
Our Team
The world viewed from data
Interview with
T map Data Part
Dongwoung Kang | T map Service Team Back in the past when the term "Big data" was not a familiar part of our daily life, T map data only counted on simple statistics and analysis that had been additionally checked by our Development Team. Since 2014, the year when the analysis of T map data started in earnest, Data Part of T map Service Team has been dedicated to the improvement of internal services and finding insight by actively cooperating with many institutions.
Interviewer

Benedict
Kim

Unmin
Baek

Dongwoung
Kang
Q.
Please introduce yourself and
tell us what you are in charge of.
Benedict Kim | AI/Mobility Development Team
Hello, I am Benedict Kim from AI/Mobility Development Team of
SK Planet. I am mainly in charge of data processing and reporting
after getting requests from T map internal members or business
partners.
Unmin Baek | AI/Mobility Development Team
Hello, my name is Unmin Baek and I work at AI/Mobility Development
Team of SK Planet. I am in charge of NBIS and TOS in T map.
NBIS is a BI system of T map showing various types of indicators.
TOS stands for Target Offering System, and this system combines
characteristics of customers that were previously sorted to make
a target group.
Dongwoung Kang | T map Service Team
Hello, I am Dongwoung Kang from T map of SK Telecom. My duty
is to carry out various analyses based on T map data and apply
newly found insight to service planning and operation. Shinyoung
and I carry out data analysis in response to diverse requests,
while Woon-min focuses on systemization of repetitively
required tasks through Web or infrastructure.
Q.
What exactly does Log mean?
Benedict Kim | AI/Mobility Development Team
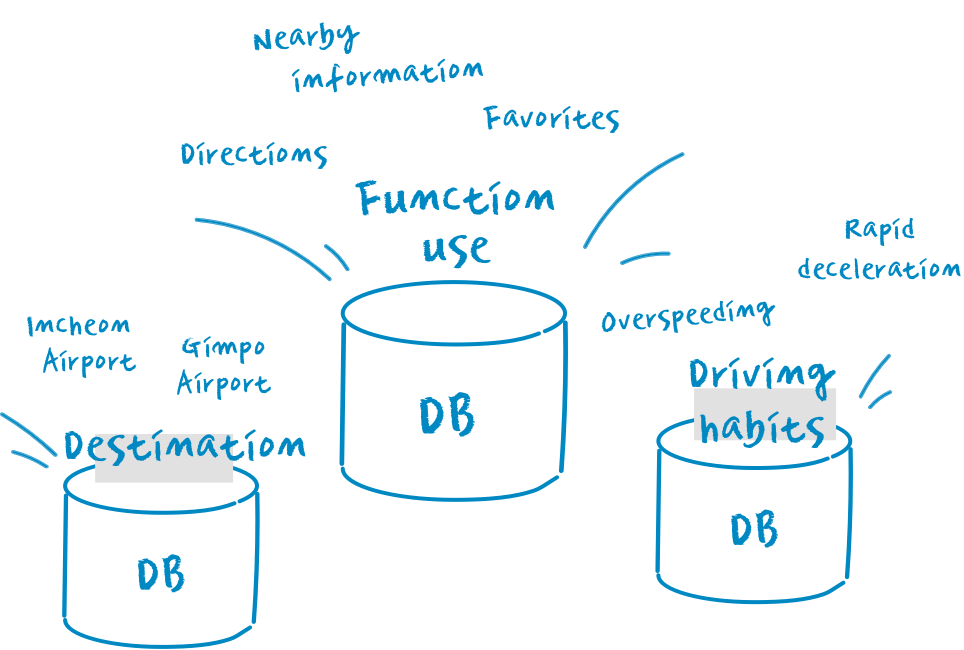
When using T map App, some information is recorded, for example, display
movement, user's behavioral pattern and location. Each record is arranged
by item based on pre-defined rules and later is generated in a systematic
way. These records are put and stored in a space called "Database."
Dongwoung Kang | T map Service Team
When using T map, you search for the destination and select one of the route
options, so you can start driving to the destination. Every process is recorded.
Such records are clearly classified by type and stored in Database.
Q.
How do you analyze data?
Benedict Kim | AI/Mobility Development Team
Data analysis is divided into two tasks. The first one is to analyze data required
from inside our company. The second one is to analyze data required
from outside, I mean, external requests, in cooperation with partners. Most
of the time, I deal with external requests. The external institutions asking for
data analysis include partners such as Kia and Volvo. We provide data according
to needs of corporations requesting. We also receive requests from
insurance companies. By finding dynamics between driving data of T map
users and the involved accidents, insurance companies can design services
or gain new data insight data to make marketing more effective.
Unmin Baek | AI/Mobility Development Team
At the company level, employees mostly request data necessary for updating
T map App. In most cases, they are about general usage forms of T map.
The data is used to determine necessity for the coming update after identifying
daily usage amount and the number of users.
Dongwoung Kang | T map Service Team
When it comes to methods for analyzing different themes, they can be
largely divided into two; an exploratory data analysis (EDA) and a hypothesis
testing analysis. The exploratory data analysis is a process of finding an
answer to questions with general description like "how do people usually
spend their leisure time?" so the scope covers vast areas and the task processing
is quite complex. On the contrary, the hypothesis testing analysis
deals with the process of identifying truth or falsehood regarding specific
cases such as "Is this function mostly used by frequent drivers?" Therefore,
it is a relatively simple processing work.
Q.
How do you approach data to analyze it?
Dongwoung Kang | T map Service Team
Well, each analyst may have his or her own approach method. In general,
in the first stage, we need to understand what the themes are about. Those
who request data analysis are not expert in data, so it is difficult to figure
out the general background required for the analysis if we have only the
request content. In this case, we must ask the client about some details of
the motives to understand first the context of the request. This way, we can
understand the background with precision. For this reason, there must be
sufficient talks between the client and the analyst. We must prevent the situation
in which the client receives the result and says "No, no, this was not
the answer I wanted." Therefore, it is vital that the analyst should know how
to sympathize with the requester. After that, the analysist ought to explain
using an easy expression in order for the client to easily understand the
analysis result and utilize it.
Q.
Have you had any eye-catching data
results or some interesting topics?
Dongwoung Kang | T map Service Team
Yes, I remember a feature story where I participated with Joong
Ang Ilbo (Daily). I was making various data analyses including
the commuting hour pattern in Gangnam and Pangyo. The period
coincided with the time when the 52-hour workweek policy had
been just implemented. We compared which changes have really
appeared before and after adoption of this policy. According to the
analysis result, we realized that the commuting hours of Pangyo,
the city mainly composed of IT industry, showed a sharp contrast
with those of Gangnam. In Gangnam, the traffic volume evidently
increased during the usual commuting hours. On the other hand,
Pangyo with a flextime environment showed dispersion in the
commuting hours by and large. From 5 pm on, the traffic started
to rise. To be honest, the task was challenging, but, at the same
time, it was quite interesting to witness the effects of the national
policy through a data analysis.
Unmin Baek | AI/Mobility Development Team
I participated in the analysis of promotional effects on TV media
including "Baek Jong-won's Alley Restaurant." After looking into
the influence of promotional effects of mass media and subsequent
aspects, some interesting results surprised me, which are
partly describe in this book.
Q.
What competence does
this data analysis work require?
Benedict Kim | AI/Mobility Development Team
I just want to emphasize that all users should drive safely since T map service
is used during driving. As navigation notifications pass, navigation information
is not an absolute mandatory tool but just a means of assistance.
Please remember that judgment of each driver on the road situations is
highly important as well.
To begin with, you must have knowledge of relational data. In the second
place, reading plenty of books is helpful because, for analyzing, you need
to come up with number of cases as many as possible. In addition to that, I
think abundant curiosity will be a plus for this area. It is because curiosity
about data can lead to the capacity of capturing new analysis and patterns.
Unmin Baek | AI/Mobility Development Team
When reviewing T map data, I understand why the top winner gets the place.
As more people use the service, data is accumulated as a result. Thanks
to this, T map can build experience and strategic knowledge. The changing
content is quickly updated to the next stage despite errors in algorithms.
While analyzing data details, we always think about how to improve our
service for our customers. Keep supporting our service and the quality will
improve. That's' for sure.
I think it is essential to develop the ability of paying attention to details and
precision as an analyst of key indicators. This duty asks you to keep looking
at the same numbers every day, and it is easy to miss every detail. However,
since key tracking indicators determine successful business choices, this
quality of attention to precise details should never be disregarded.
Dongwoung Kang | T map Service Team
All I want to say is "thank you." Back in the age of feature phones, we had
a small amount of information obtained from data because there were not
many users. However, as the usage volume is getting higher and people
use with greater frequency, data increased as a result. Thanks to users, we
were able to extract more reliable and valuable information than before.
We process data making an effort to return it as maximized benefits to our
valued users. We will work on data analysis to fulfill expectations of our
customers for more convenient services and greater benefits.
I totally agree. To sum up, data analysts require meticulous precision about
ten times higher than that of others. I believe that this duty does not fit
someone who is half meticulous. This job of data analysis suits those who
are usually considered meticulous and precise. One important quality to add
is imagination. The analysist's imagination is a key tool to determine how
diversely data can be applied.
Q.
Do you have any messages
you would like to deliver to T map users?
Unmin Baek | AI/Mobility Development Team
I just want to emphasize that all users should drive safely since T map service
is used during driving. As navigation notifications pass, navigation information
is not an absolute mandatory tool but just a means of assistance.
Please remember that judgment of each driver on the road situations is
highly important as well.
Benedict Kim | AI/Mobility Development Team
When reviewing T map data, I understand why the top winner gets the place.
As more people use the service, data is accumulated as a result. Thanks
to this, T map can build experience and strategic knowledge. The changing
content is quickly updated to the next stage despite errors in algorithms.
While analyzing data details, we always think about how to improve our
service for our customers. Keep supporting our service and the quality will
improve. That's' for sure.
Dongwoung Kang | T map Service Team
All I want to say is "thank you." Back in the age of feature phones, we had
a small amount of information obtained from data because there were not
many users. However, as the usage volume is getting higher and people
use with greater frequency, data increased as a result. Thanks to users, we
were able to extract more reliable and valuable information than before.
We process data making an effort to return it as maximized benefits to our
valued users. We will work on data analysis to fulfill expectations of our
customers for more convenient services and greater benefits.


Previous


T map Trend Map 2020
관련사이트